|
| |
 |
Features |
|
| |
 ...office growth solutions
|
|
|
|
| The following
are some Features of StarStats™
|
Robust Report and Chart Utility
Create reports or charts on Office
Statistics. Compare up to 9 stats on the same report. Stats can be sampled daily, weekly, monthly, or
yearly within an adjustable time window. Analyze statistics for the Entire Practice (EP)
and/or Include associate doctors for comparison. -
For any Stat Create a Quota or Goal Line and map
a running total for comparison.
-
Analyze if your stats are meeting your output
expectations.
|
|
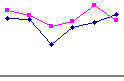
Example Chart: Quota Graph - Production - Daily Totals for One Month
-
Expected Production (Prod) Goal for the
month of January, 2010 is $70,000 (red line)
-
Comparison Running Production Total (blue
line)
-
Daily Production Totals (light blue line at
bottom)
-
No dollars displayed on days the office is
closed
-
Analysis: Monthly Production meets
expected goals on 1/11 then falls below expectation for the
rest of the month with a small rise on 1/31.
Edward James Chiropractic - Edward James M.S.D.C. - Quota Graph - Production - Daily Totals
From 1/1/2010 To 1/31/2010
|
|
|
Example Chart: Chart With Running Totals
-
1 month Production Totals and Total
Collections for January
-
Production $$$ running total (green line)
-
Total Collection running total (blue line)
-
Analysis: Collections was following
the production at the beginning of the month; but Dollars
Collected started downward in comparison around 1/13 and
again around 1/28. The Overall trend indicates that the difference between
Dollars Produced and the Total Dollars Collected is
increasing over the time sample. This indicates an
increase in un-collected dollars especially between 1/14 and
1/20 for services rendered.
Edward James Chiropractic - Edward James M.S.D.C. -
Production Totals for the year 2007 between January and June - Daily Totals
From 1/1/2010 To 1/31/2010
|
|
|
Example Chart: Bar Chart and Report
-
6 month Production Totals of two Doctors
-
Production $$$ for Doctor 1 (red bars)
-
Production $$$ for Doctor 4 (blue bars)
-
Companion Comparison Report containing Production
Totals for all Associate Doctors (Dr1 through Dr5) and including
Production Totals for the Entire Practice Totals (the sum of
all doctors) for comparison.
-
Comparison Report Automatically Calculates the Percentage of
Associate Doctors' totals with respect to the Entire Practice (EP)
totals.
-
Analysis: Overall Production dollars
for Dr1 and Dr4 seem to be about even. However Dr1 has had
one better month than Dr4. According to the report
that follows the chart, Dr4 is contributing approximately
19.1% to the Entire Practice and Dr5 production numbers
contribute 1% more around 20.1%. The overall trend of
all doctors indicate a good even distribution of
contribution to the Entire Practice totals which is an ideal
scenario.
Edward James Chiropractic - Edward James M.S.D.C. -
Production Totals of Dr1 and Dr4 between June and
December - Monthly Totals
From 6/1/2009 To 12/31/2009 |
|
|
Report
|
|
|
|
Comparison Historical Charts and Reports
|
|
Example Historical Chart: Compare current data values to historical values
from previous years.
-
Entire Practice (EP) Production Totals for the year
2007 compared to the previous year 2006
-
Production $$$ for the Entire Practice year 2006
(blue bars)
-
Production $$$ for the year 2007 (red bars)
-
Analysis: Comparing your current year production
values to the previous values shows trends in the overall market as
well as your practice. Comparing the two years, last years numbers
are better in the first quarter but then drops off in the last
quarters. Additional reports and analysis can yield further
information provided by StarStats.
-
The Production report following the chart below
indicate approximately a 5 % increase in total yearly production
from 2006 to 2007.
Edward James Chiropractic - Edward James M.S.D.C. -
Production Totals of Dr1 and Dr4 between June and
December - Monthly Totals
From 6/1/2009 To 12/31/2009 |
|
|
Report
|
|
|
|
Robust Report and Chart Utility
Create reports or charts on Office
Statistics. Compare up to 9 stats on the same report. Stats can be sampled daily, weekly, monthly, or
yearly within an adjustable time window. Analyze statistics for the Entire Practice (EP)
and/or Include associate doctors for comparison.
| Month of Year
2007 |
Production
Dollars for
Entire
Practice |
Production Dollars for
Doctor
Associate 1 |
| January |
$176,814.66 |
$44,866.08 |
| February |
$163,284.55 |
$36,450.72 |
| March |
$166,160.08 |
$43,868.36 |
| April |
$155,114.30 |
$36,363.22 |
| May |
$181,388.46 |
$43,203.44 |
| June |
$39,792.14 |
$9,798.00 |
Informative and Practical Production Analysis Reports
Formulas can
be easily viewed to enhance conceptual understanding.
Easy access to
Office Activities such as:
- Number of New
Patients
- Number of Patients Visits Average
- Number of New Patients
- New Patients Opportunities
- New Patient
Conversion Percentage
- Average Dollars
Charged per Visit
- Average
Paid Dollars per Visit
- Case Average Dollars Produced
- Average
Dollars Paid by Patients per Case
- Cost per Case
- Net Profit Per Case
- Cost Per
Visit
- Office Percentage
Overhead
Practice Analysis including Expenses
- Secured Area viewed
only by the
main doctor and administrator.
- Dollar amounts and other Totals can
be viewed yearly for comparisons
and trend analysis.
Employees work harder when $$$ incentives are in place.
Setting up incentives based on the high values of certain
office income generating statistics makes sense.
- The bonus feature can be turned
off or hidden if desired.
- The Bonuses Utility
can be totally customized.
- Most any stat can be
monitored for bonus activity.
- Automatically
keep track of high values, Calculates, and determines Bonuses that are Due.
- We provide defaults
that have been tested and determined to be an effective measure of
office vitality.
- StarStats offer 4
different bonus types:
- Daily bonuses which high
values are calculated every day.
- Weekly bonuses which high
values are calculated weekly.
- Monthly bonuses.
- Yearly bonuses (beta release).
- Daily Bonuses can be
broken down to sub categories related to different operational
hours during the week.
- At least 7
variations of office hours are available.
- Separate Reports can
be generated for each Bonus Type.
Example: From top to bottom
each row exceeded the Max Production $$$. Each time a
max value was exceeded yielded a bonus of $15.00.
 |
Example: Easy Matrix Design
provides easy setup of different operational hours that the
office is open (Full days and Partial days). Boxes checked indicate, in
a practical sense, that on a particular day the office is
officially open for so many hours: Monday (M) the office is open for a full day represented
by 8 hours and Tuesday (T) the office is open for a partial day
(4 hours).
 |
|
|
|
|
|
Click on the
links for more details
Four
different User Ids each with their own security level:
StarStats™
offers types of user login ids which are controlled by
access codes and are as follows:
-
CA: for data entry and for
seeing if a bonus was achieved (usually for the front desk
or staff entering the daily stats).
-
Manager: for additional activities such as analyzing
the production report without expenses included, and bonus reports.
-
Doctor or Administrator: for setting all software
defaults in addition to bonus amounts, parameters and reports, practice expense
entries, analysis and reports (usually reserved for the
primary doctor).
-
Administrator: has complete
access to all functions.
Data Entry Forms:
Customizable User Defined Statistics:
Example: User Defined
Office Daily Statistics
 |
 |
You can monitor and analyze
to determine what percentage of your
practice comes from certain sources which can be compared to monies
collected for those sources.
List your own referral sources:
such as:
specific attorneys
phone books
insurance companies
etc...
Example: Custom Patient Referral Types
 |
User
Friendly
Form Navigation:
Data is entered in a very user
friendly environment.
StarStats was design to
make the data entry process as friendly as possible
minimizing mouse clinks and optimizing keyboard involvement.
Auto Navigate to
the Next Data Form after Saving the Current Data.
The screen progresses to the
next sections automatically.
The order of how these
sections appear can be customized.
Auto Navigate to the next
day in the same form.
Skip
Saturday and Sunday option instructs data entry to move from
Friday to Monday of the next week for those practices that
are not open during the weekend.
Two
different Data Entry Views:
Example: CA Daily Stats
entered for the entire week
 |
Daily and Weekly Views
are available for the following Data Entry Types:
|
|
|
| |
|
StarStats Copyright © 2009 by
Hornberger Software, LLC All Rights Reserved
|
|