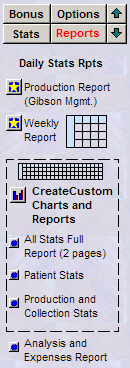
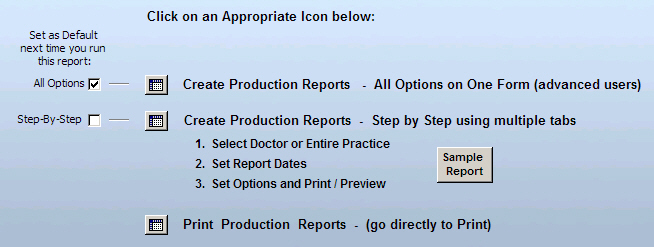
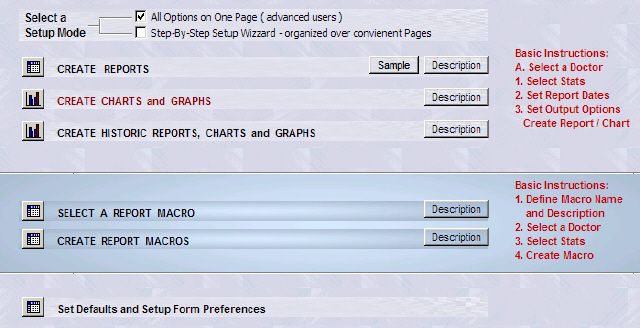
Easy to Setup and Create a Report
- Select a Doctor and Set Options.
- Set the Dates (time period).
- In some cases: Select the Type of Reports
- Print / Preview
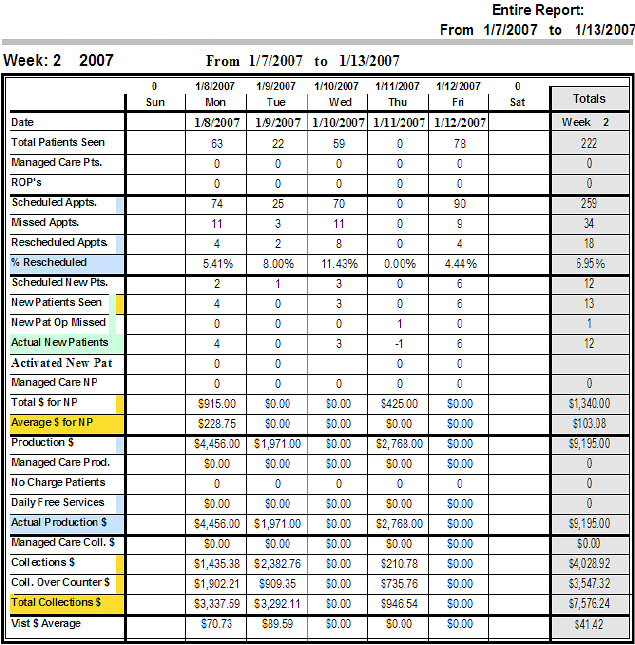
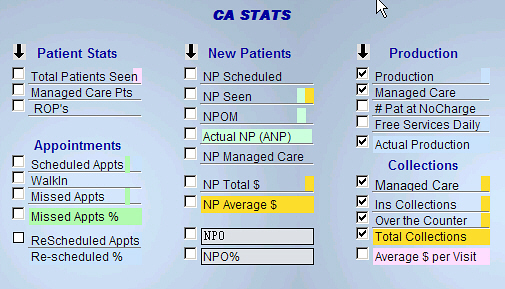
Example: Production Report Results
Some Statistics are listed below:
- Total Number of Patient Visits
- Total Number of New Patients
- New Patients Opportunity Missed
- Actual New Patients
- Percentage of New Patient Opportunities
- Collection Ratio - Percentage of Dollars
Produced compared to the Actual Dollar Income
- Average Total Patient Visits per month
- Average Total Number of New Patients per
month
- Average Patient Visits
- Average Dollar ($$$) Income per Visit
- Average Production Dollars ($$$) per Patient Visit
- ROP = Reactivated Old Patients
Entire Practice
| Year |
Patients |
Actual
Production |
Total
Collections |
Collection
Ratio |
Expenses |
ROP |
| 2006 |
Patient Visits |
New Patients |
New Patient Opportunities Missed |
Actual New Patients |
NPO% |
| January |
954 |
26 |
0 |
26 |
100% |
67,716.00 |
54,329.37 |
80.23% |
|
13 |
|
February |
868 |
20 |
0 |
20 |
100% |
62,629.00 |
50,954.80 |
81.36% |
|
16 |
| March |
1184 |
28 |
0 |
28 |
100% |
85,900.00 |
55,744.44 |
64.89% |
|
18 |
|
Total |
3006 |
74 |
0 |
74 |
100% |
216,245.00 |
161,028.61 |
74.47% |
|
47 |
Report Summary example
| Pat Visits
| New Pat |
Production |
Collections
|
63.87% Overhead |
| Average Patient Visits -
901.8 |
Average Production Dollars - $72,345.41 |
$58,292.19 - Average
Dollar Income |
$37,229.28 - Average Expenses |
| Average New Patients - 28 |
Average Dollar Production per Visit -
$80.23 |
$64.64 -
Average Dollar Income per Visit |
$41.29 - Cost per Visit |
| Patient Visit Average -
31.4 |
Case Average - $2,516.36 |
$2,027.55 - Case Average |
$1,294.93 - Cost per Case |
| Net Profit - $21,062.91 Net Profit per Case -
$732.62 Visits to Product a Profit -
20.03 |
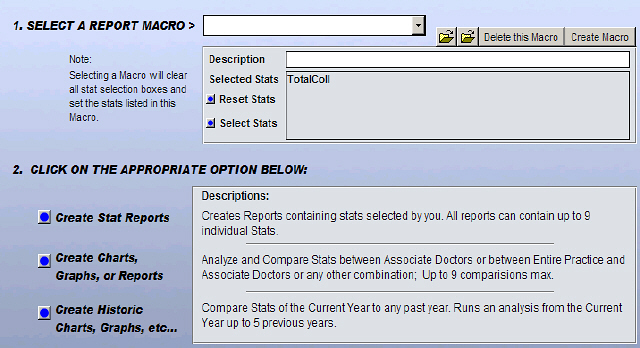
Create Custom Reports and Charts
on just about any Stat
-
Flexible Charts, Graphs and Reporting Utility:
Easy to Follow Menu Driven System: The report
and chart generator can create simple reports on
almost any statistic up to 9 on one page.
All
Charts can be Previewed and Enlarged: Dates, Chart
properties, and other refinements are available in the preview
and enlargement mode before printing.
All Reports and Charts can be Printed:
There is a convenient option that relocates the date controls
off the final chart enlargement. The data controls will still
function but will not print out. Only the most important
information is shown. This is ideal for good clean
presentations.
Versatile: StarStats™ can
automatically calculate and print simple charts and reports as well as more
complicated reports and charts.
Comparison Charts: Charts that
compare data of the Entire Practice to all the associates working in the practice.
Historical Charts:
Historical charts can be generated comparing the current year to
the previous
years' activities.
Setup Macros: Report Setup Macros can be
created that automate the setup for those frequent reporting tasks.
Record the setup on the first iteration and reuse this macro each time
results in One Button Setup.
Some Report Examples
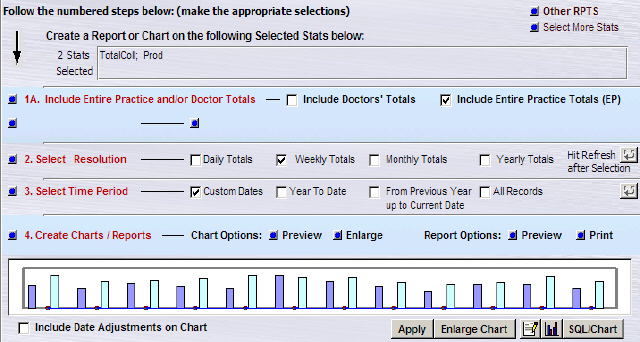
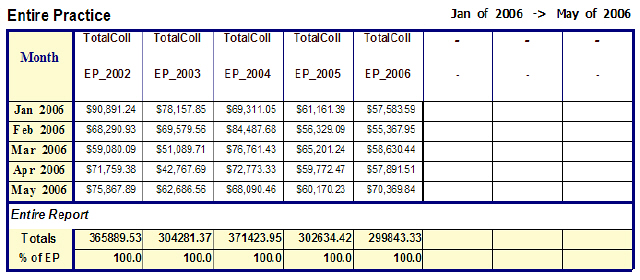
Example 1 - Total Dollar Income compared to
Total Dollars Produced:
This is a Typical Chart
showing Total Collections $$$ and Total Production $$$ so far for the
entire current year.
Various Resolutions are available: The
resolution is set to monthly and calculated for each month. Other resolutions
or sample rates (Yearly,
Weekly, and Daily) are available.
Point of Interest: The chart shows that not all
dollars $$$ produced are collected and recorded as Income.
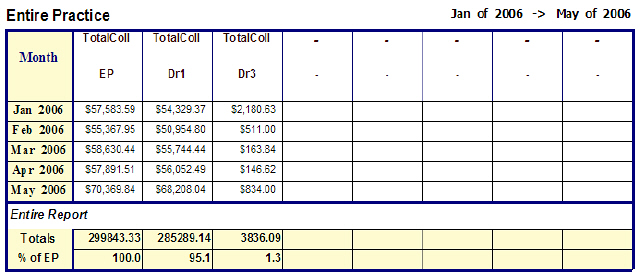
Example 2 - Comparison Report:
Compare Entire Practice to other associates in
the practice.
Percentages are
automatically calculated.
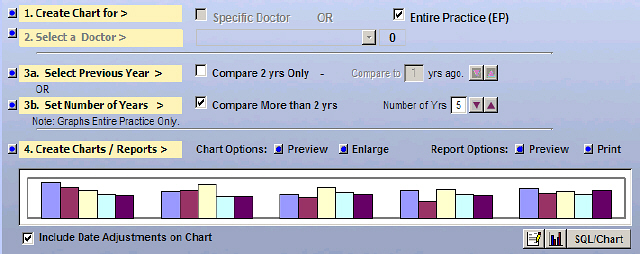
Example 3 - Historic Report:
Comparing the current totals to previous years
totals.
Comparisons can be made to any year in the past.
You can easily spot trends and identify what areas
the business has grown. Working in the historic mode, only one
stat can be compared at one time to previous years.
(Chart: Five years of monthly Collections
for the Entire Practice)
(Report: Five years of monthly
Collections for the Entire Practice)
(Line Chart: Five years of monthly
Collections for the Entire Practice)
Note: Can be enlarge to portrait size and printed.
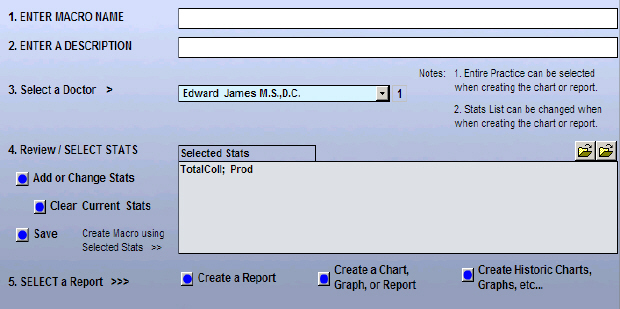
Macro Setup Utility:
For those reports that are reviewed often, a Macro Utility is
available. It can record various scenarios consisting of
various selections of stats. Running the macro at a later
time will recall these selections setting the stats
automatically. All that is left to do is to select the
reporting dates and type of report and or chart.
A Macro can be created before or
after selecting the desired stats. Clicking the [Create Macro]
command button available on each stat dialog form or starting from
the main menu will prompt the user to follow a few easy steps.
At a later time selecting a macro will automatically
set the appropriate stats. It would be simple task to select
the reporting date and set the preferences prior to generating the
report.
-
Name the Macro in a way that
describes its content and write an abbreviated description.
-
Select
the stats if have not been selected and chose the type of report
your wish to create.
-
Clicking the option in step 2 will
navigate to the appropriate page.
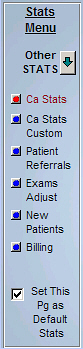
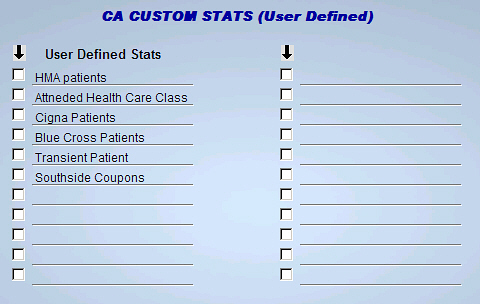
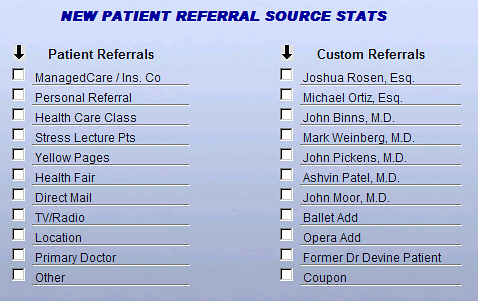
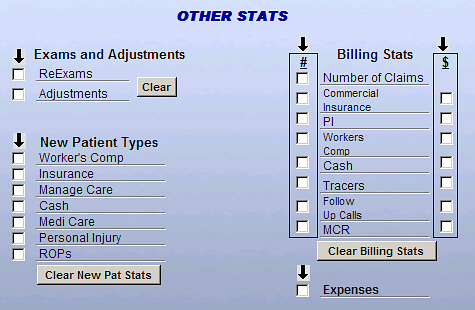
Stat Selection Forms:
The following several forms illustrates the stats
that are available and the selection process.
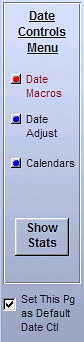
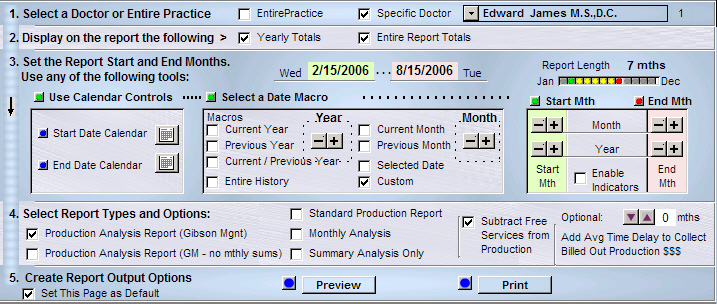
Versatile Date Selection Utilities
StarStats™ Reporting Utility provide three Types
of Date Selections Controls which any one can be set as default when
the reporting tool is opened.
Date Macro Controls:
- Provide a quick method to set both Begin and End output
reporting dates with a single click.
- Other date adjustment controls are available that can
refine each date to the desired day
Calendar Controls:
- Calendar Controls allow to directly set the Begin and End Dates
Manual Date Adjustments:
- Another set of controls provide precise manual Begin and
End Date adjustments